If you are like most of the nonprofits we work with, you use a surprising amount of technology to run your day-to-day operations.
You have a website platform for your content, a donation tool to process online giving, an email marketing tool for announcements, a donor database to track all of your constituents, and probably a few more.
We call this your “Tech Ecosystem” and if you haven’t read our article all about this, stop what you are doing and scan through that first.
Depending on how you’ve organized this tech soup, you’re either leaning into your setup or fighting against it.
Or like some of the clients we work with, you’re sort of just ignoring the problem and soldiering on.
We salute you, but that is not a solution.
“I didn’t realize this was so horrible”
That is a direct quote from an ecosystem mapping workshop we recently did with one of our nonprofit clients.
(If you have suggestions for a more exciting name, we’re listening)
The focus of this exercise is to create a visual map of all the tools being used by the nonprofit and the way these tools interact with each other and members of the organization’s team.
Once we helped the client to see their tech mess, they realized they had a problem.
Signs of an ecosystem problem
What are some of the problems that nonprofits might be facing due to a poorly designed ecosystem of tools?
What are the signs of a poorly designed ecosystem that nonprofits can watch our for?
So glad you asked. Let’s get started.
Manual Data Entry
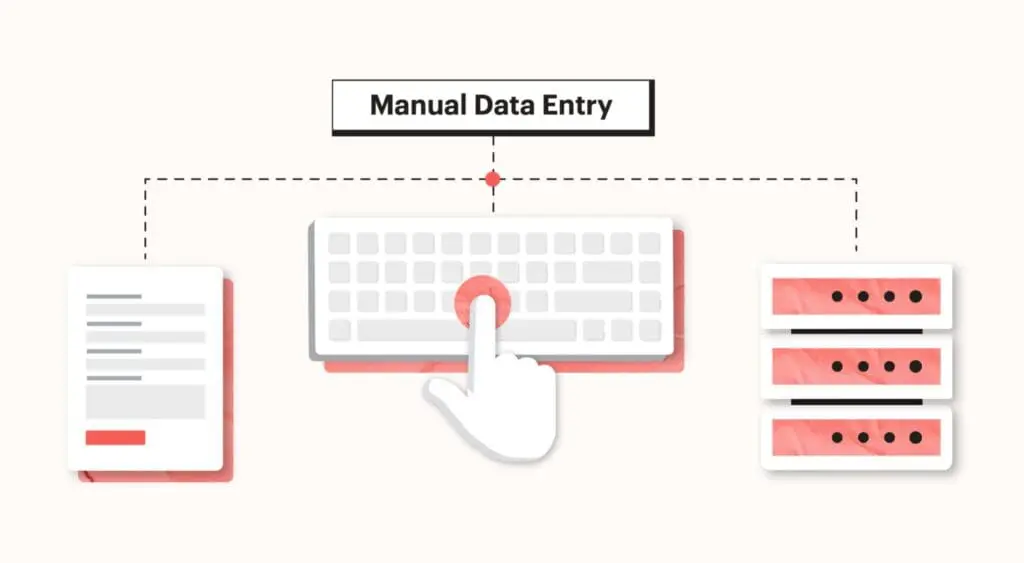
If you’re constantly having to take information (like email or address info) from one tool and update it in a separate tool, than you have a manual data entry problem.
For example, we had one client who had to take form submissions through the website and copy and paste all of that data into both their email marketing tool and their CRM.
Why?
Definitely not because they enjoyed the process. They were doing this because their form tool on the website wasn’t talking directly with either of these other tools in the ecosystem.
Therefore, someone on their already small and stretched team was responsible for manually migrating the data from one tool to another.
Tool Redundancy
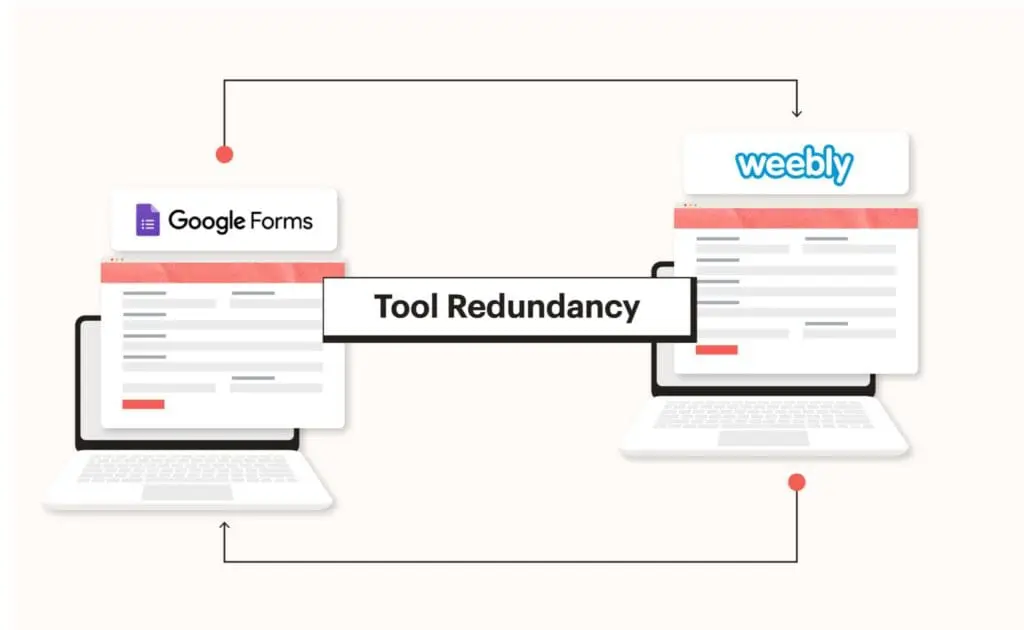
Another common problem we find when clients don’t take a hard look at their ecosystem is that they are using multiple tools for the same job.
A recent example is of a client who was using both Google Forms and Weebly Forms to capture and process data through the website. Luckily this wasn’t costing them extra because Google Forms is free, but, it was still another place that was accumulating “stuff”.
In other cases, we find that nonprofits are actually spending $$$ on multiple tools that do the same thing.
This can happen for one of two reasons:
- Poor tool selection
A nonprofit might have selected a tool that offers most of what they are looking for but is missing a key feature they need, so they layer on an additional, comparable, tool that does include that extra feature. - Poor tool maximization
A nonprofit has selected and purchased a tool that will do everything they need it to do, but might require more advanced configuration. Rather than fully configure the tool for their needs they found it easier at some point to simply add an additional tool to the mix that gets the job done.
Most often, nonprofits accumulate multiple tools with overlapping capabilities because they’ve selected tools haphazardly.
When you’re stretched thin, it can be easier to just layer on an additional tool that sort of get the job done than to really sit down and map out all of the current tools your might already be using.
We get it! This isn’t a reproach.
It’s an intervention.
Incomplete Data
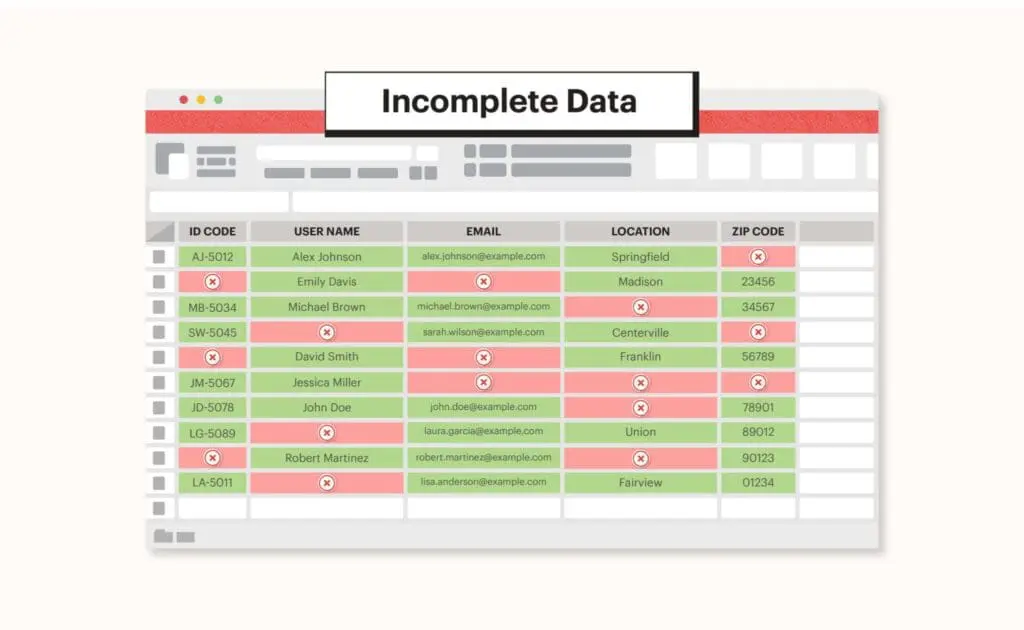
A poorly designed tech ecosystem inevitably leads to incomplete records. This is because when you are accumulating data in multiple places (website forms, event registrations, email subscriptions) and relying on human-powered management of this data, mistakes will be made.
Humans make mistakes, they get distracted. Look, squirrel!
A well-integrated ecosystem of tools that automatically move data from one place to another based on defined rules, will do a better job of keeping everything updated.
Building a better orchestra
The goal for all of the tools in your tech ecosystem is build more of an orchestra than a zoo. In an orchestra, all of the parts work together to achieve something resembling a symphony.
In a zoo, the monkey is throwing poop into the tigers cage. Not what we want.
CRM, the heart of your system
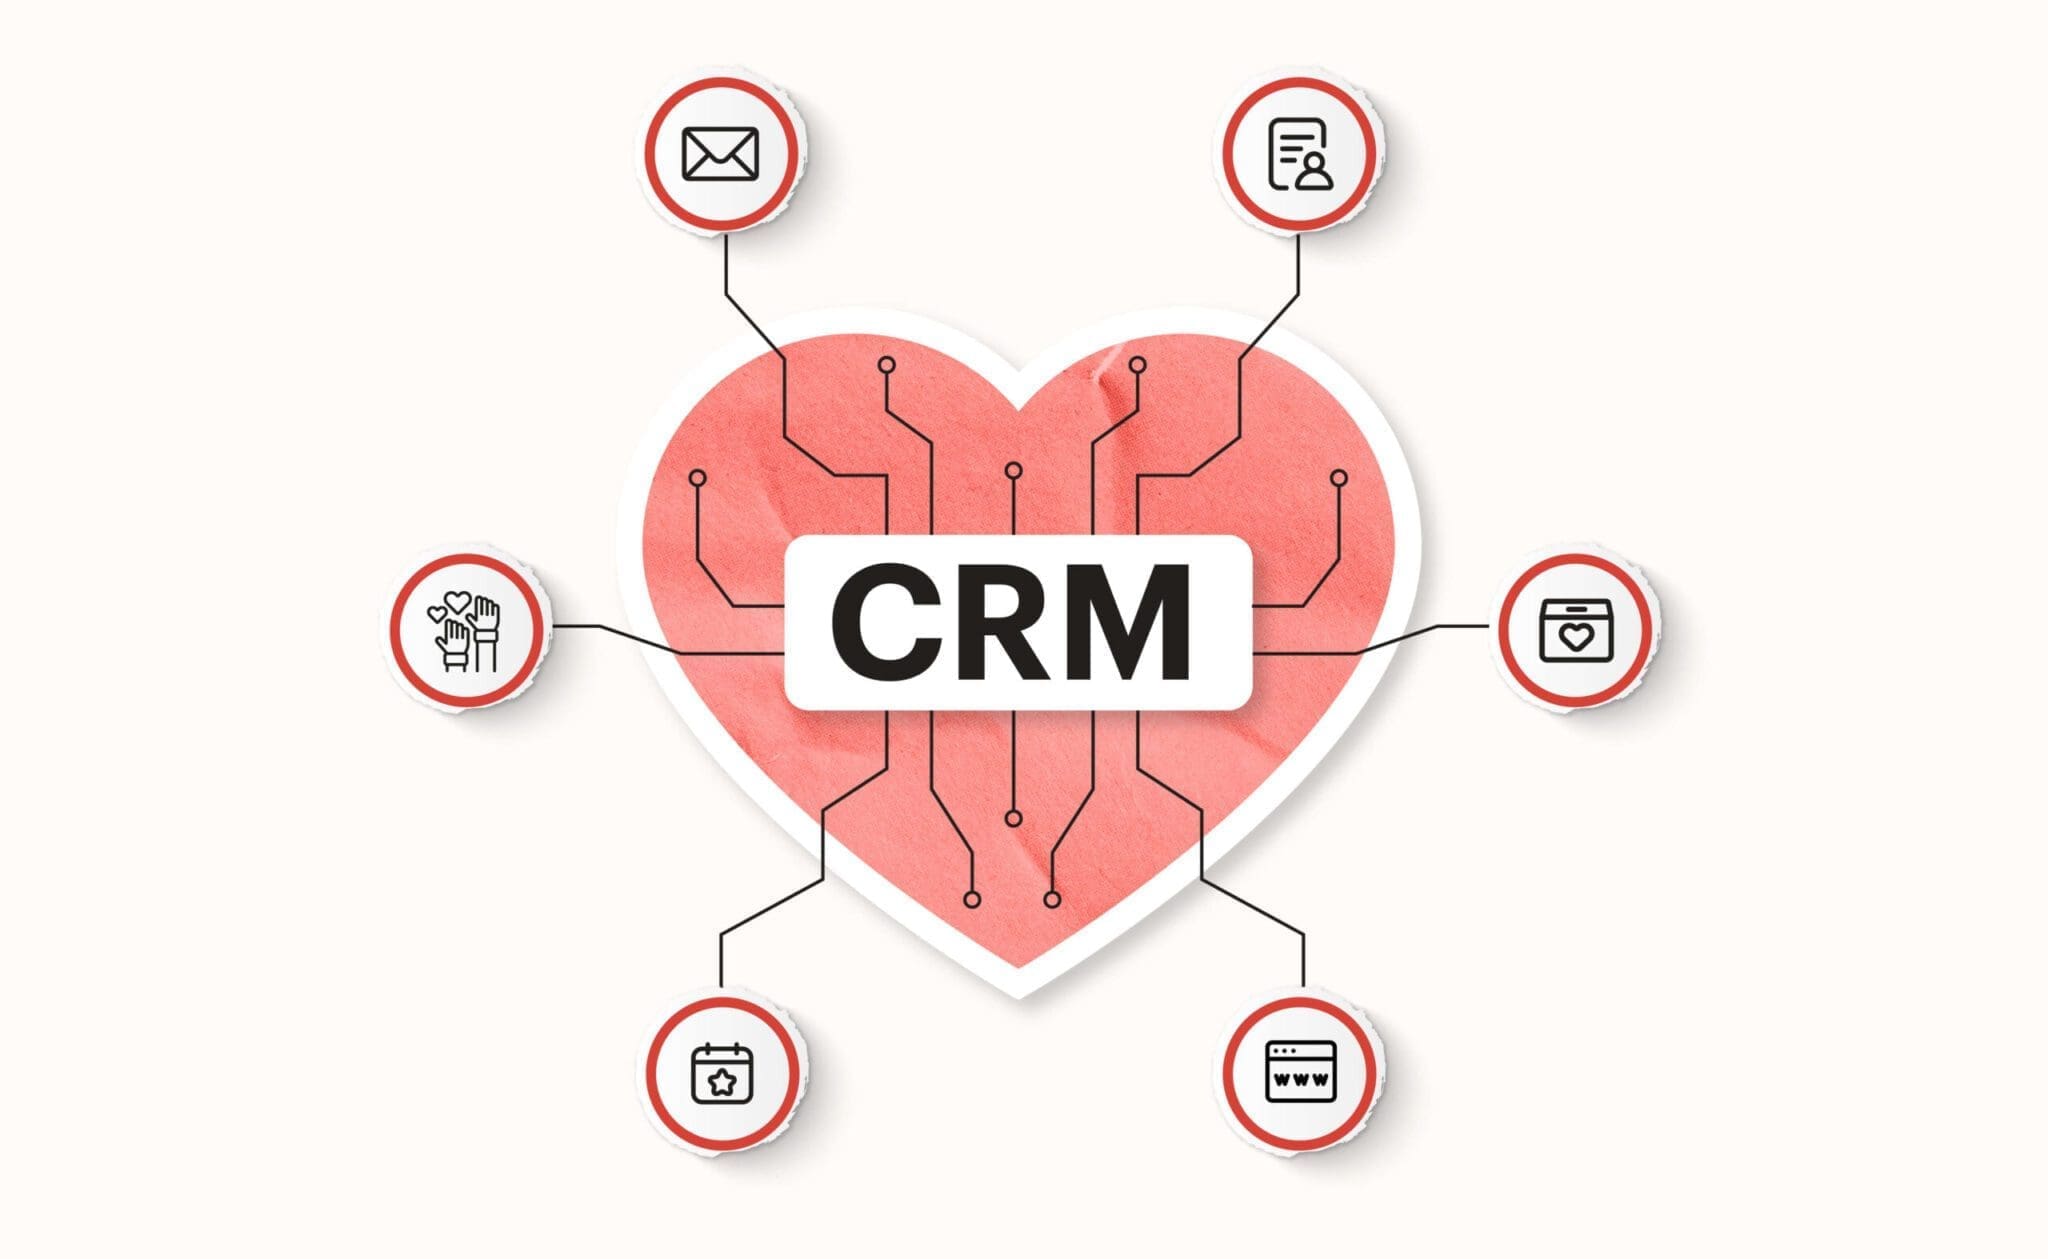
The goal for any nonprofit is to have the most complete picture of their constituents’ data as possible. To do so, they maintain databases (also known as CRMs) that house all of this important information.
The key to a great ecosystem is to ensure that as much of your constituent’s data is being automatically fed into your CRM.
This is like your heart. Everything should flow into and out of it.
Your website, the lungs
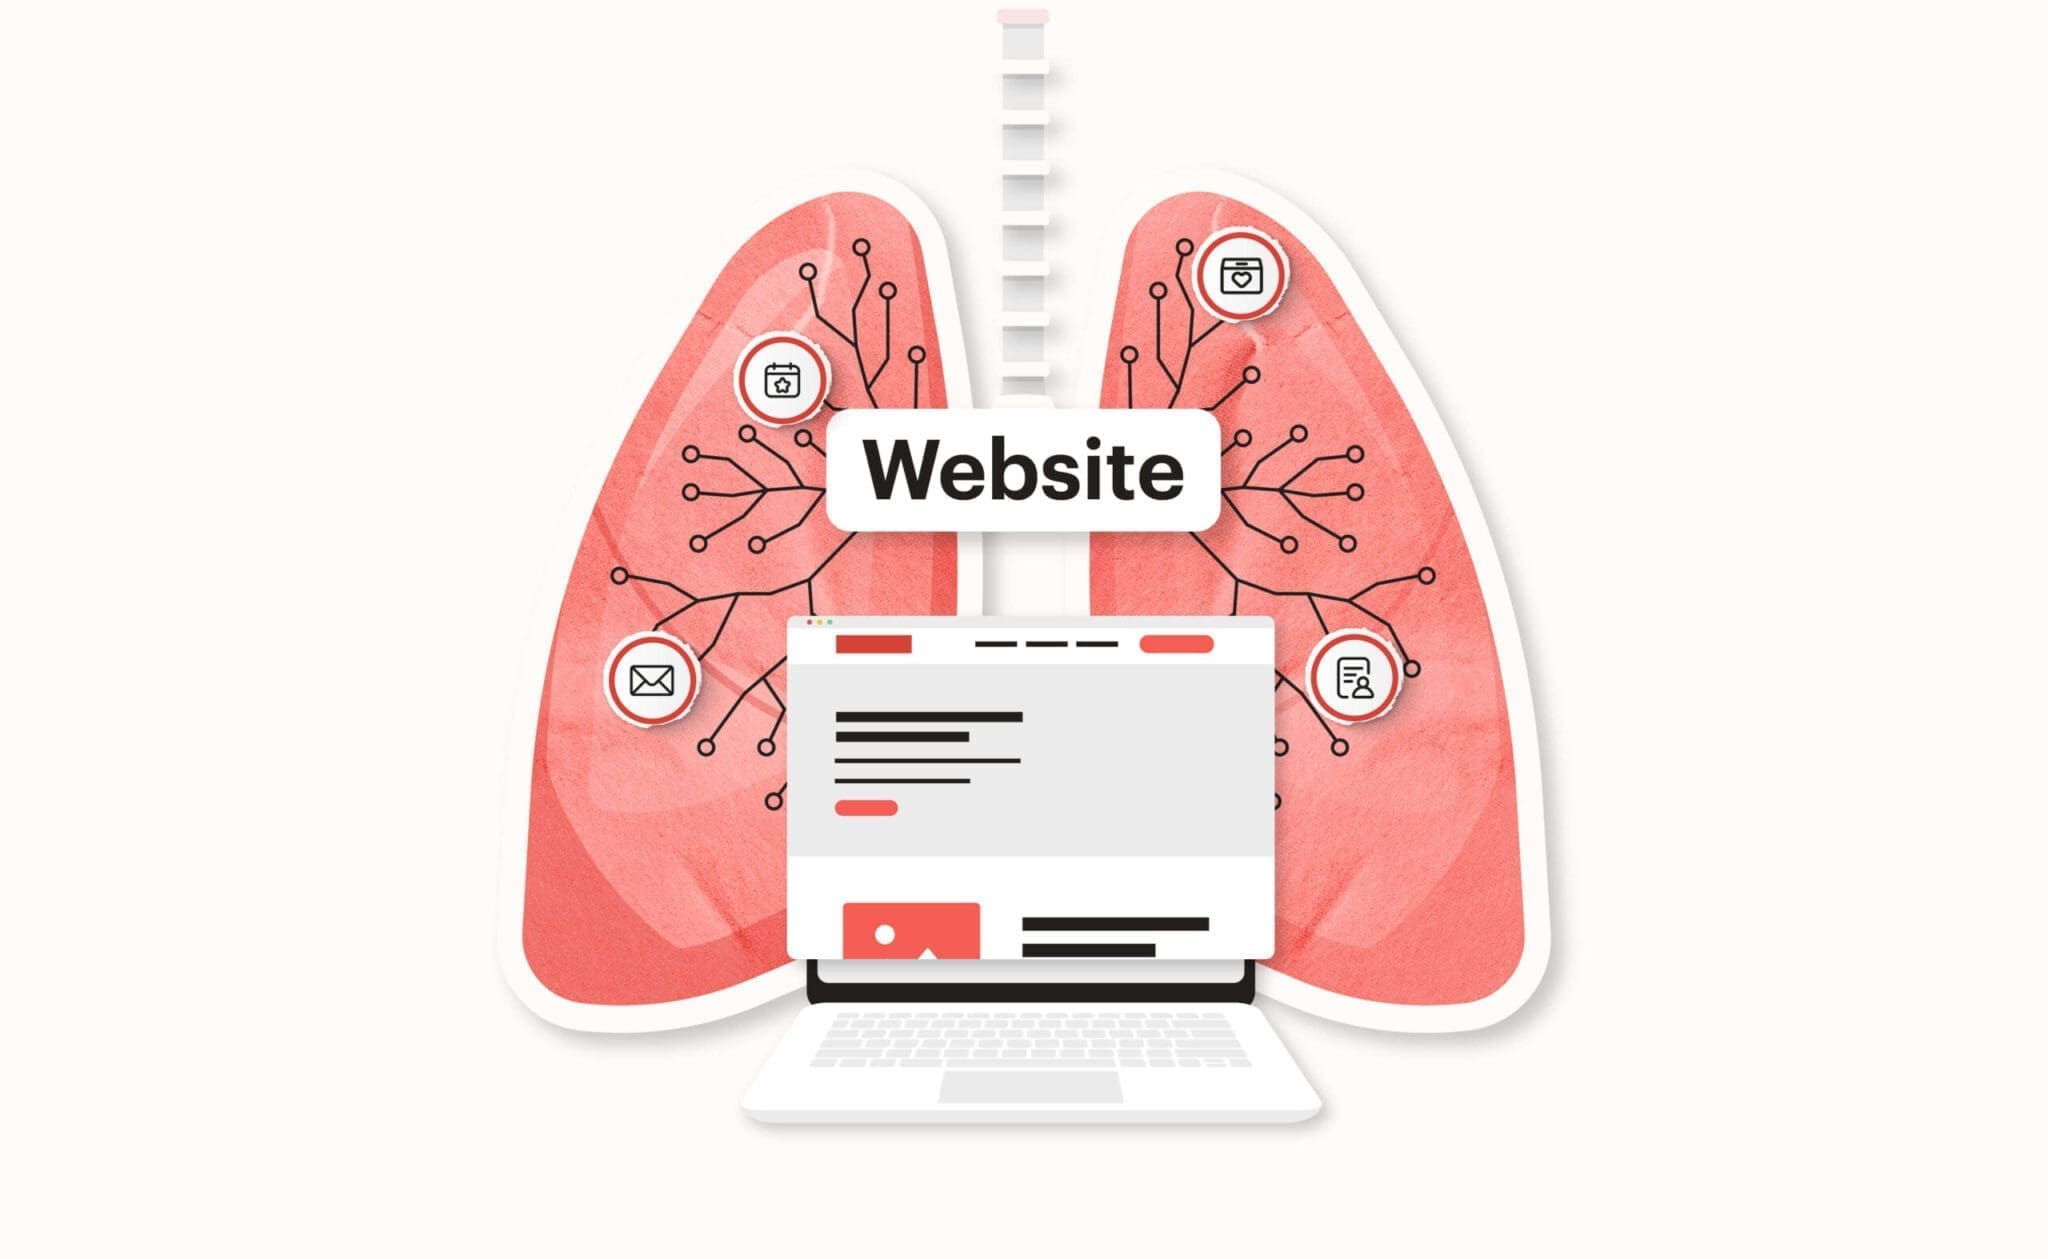
The website is a useful place to start when trying to bring order to your technology chaos.
Why is that?
Think of your website as the lungs, it’s the place where you absorb and process many of the interactions that your constituents might have with your ecosystem. This is where people subscribe to newsletters, leave donations, register for events, submit contact information, etc…
Like the lungs, your website sucks this information up to send it to your CRM.
Also like your lungs, if you don’t treat your website well and ensure that things are flowing smoothly, your CRM will suffer and you won’t be able to perform at your best.
Okay, time to put that analogy to bed.
Visualizing your ecosystem
The best way to start bringing order to your technology chaos is to visualize the current flow of data through the system.
Why is this useful?
By visualizing and mapping your tools and their relationships to each other, you can start to see the inefficiencies and potential opportunities for improvement.
Visualizing your system helps to move the abstract concepts of data, integrations, and software into concrete blocks that we can start to manipulate.
Start with your parts
The first step to building a great ecosystem visualization starts with your tools. Start presenting all of the different tools that make up your ecosystem as pieces or blocks as shown in the example from a recent client workshop we completed below:

The above visualization shows all of the nonprofit’s current suite of tools that make up its full ecosystem.
Each tool is given a separate color that will help later on when building the full visualization.
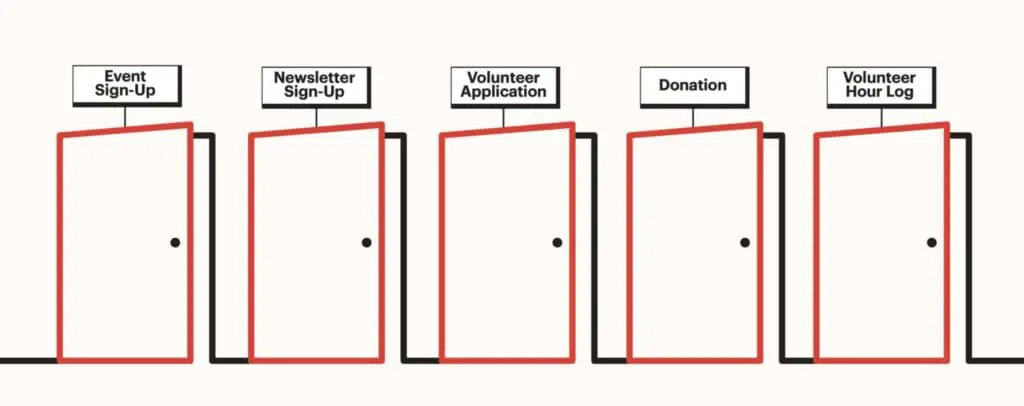
Find your website’s “doors”
Your nonprofit’s website probably has several data “doors” that facilitate an interaction between your visitor and your ecosystem.
For example, your newsletter sign-up form is a door through which a visitor’s email address can be sent to a specific contact list in your email marketing tool.
Or your event registration form is a door through which attendee information can be sent to your CRM.
There are many doors on your website through which data can travel. The example below shows the doors identified during a recent client workshop:
Connect your parts with your doors
The next step is to start mapping the journey data takes through each of your doors.
If you don’t know what happens to your data, that’s okay. Knowing what you don’t know is a great takeaway from this exercise! Just do this to the best of your ability and put a big “?” whenever you are unsure.
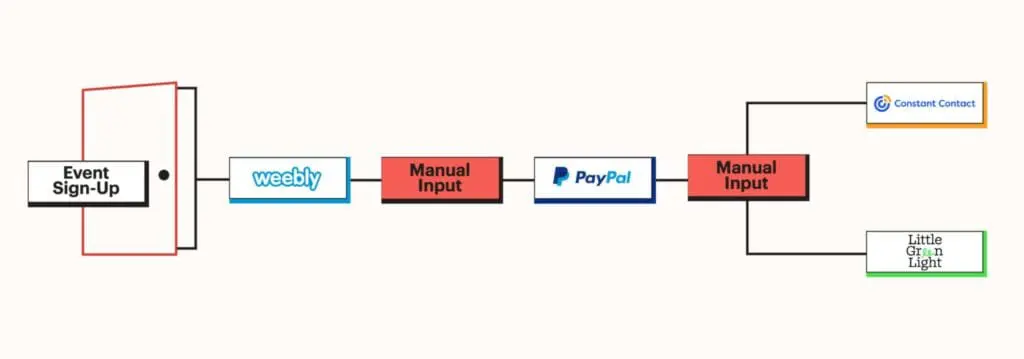
For example, what happens to the data that is entered by a visitor interested in signing up for your newsletter? The example below shows how the doors and parts might interact in this scenario:
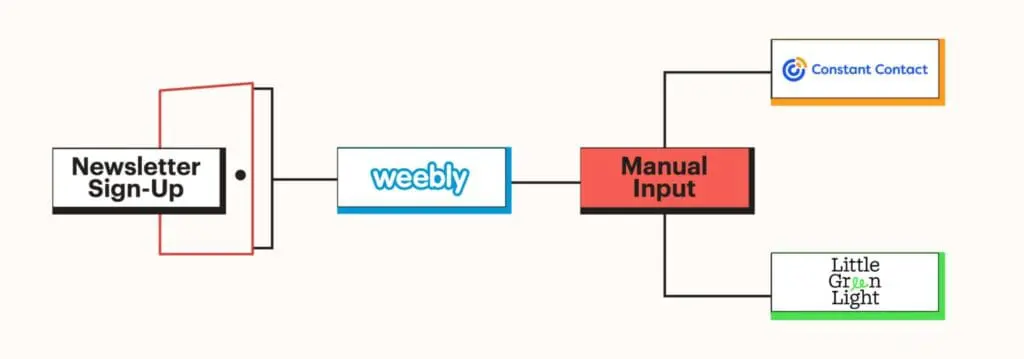
In this real-life example from one of our client’s scenarios, after a visitor submits a form on their current website (the door), which is built on Weebly, an administrator receives an email notification and then manually puts this data in both their CRM (which is Little Green Light) and their email marketing tool (which is Constant Contact).
Notice the addition of the red “Manual Input” block!
Our goal with this exercise is to minimize or eliminate all of the manual data migration work that our clients are doing.
With this in mind, it is helpful to add a big scary red piece wherever they are currently required to perform this manual migration so we can focus our efforts in our revised map.
Other examples of these visualization scenarios are shown below:
After a donation is captured through PayPal, an administrator then adds the donor’s email to Constant Contact, records the donation in Quickbooks, and adds the donor to Little Green Light.

When signing up for an event, the visitor submits a form in Weebly, then an administrator sends them a link to purchase tickets through PayPal, and then once the tickets have been purchased an admin must add the attendee to both Constant Contact and Little Green Light.
As you can probably start to see (as did our client during our workshop) often there are many opportunities to improve the efficiency of data flow through any one of your website’s doors.
A full map of your ecosystem might look something like the visualization below:
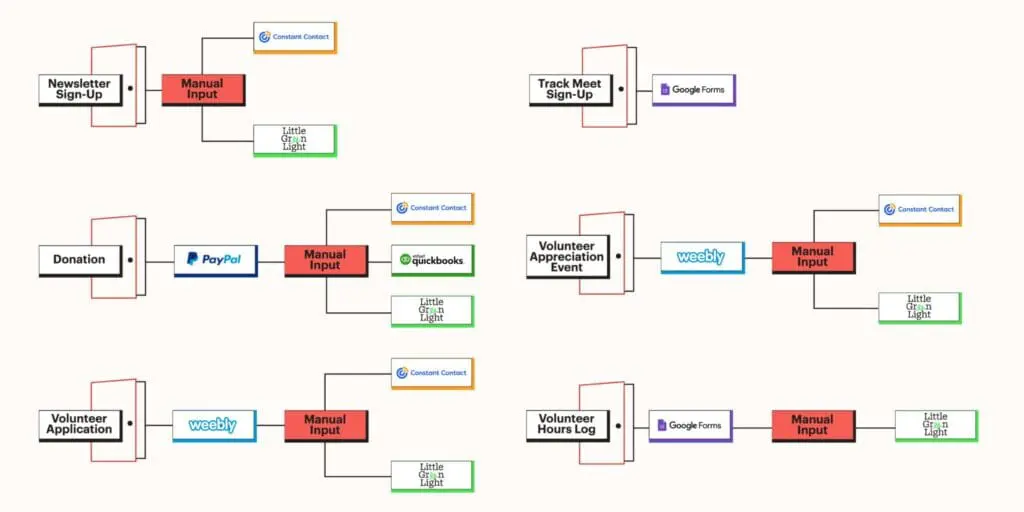
Kind of chaotic right?
That’s okay, now we are going to make it better.
Streamlining your ecosystem
Now that you’ve taken the time to visualize the current state of your nonprofit’s tech ecosystem, the next step is to start to improve it.
Evaluate your current tools
Surprisingly, you may be able to improve the efficiency of your ecosystem without having to replace or add any new tools.
Many tools have ways of automatically sending data to each other in a way that avoids having to perform any manual data work.
Just to reiterate, our goal is to eliminate the scary red “manual input” blocks.
In the example of our client’s ecosystem above, PayPal does offer integrations with Quickbooks as part of their partner directory. Meaning, that while our client has been manually moving donation information into Quickbooks, they could have automated the process long ago.
But sometimes your tools of choice just don’t want to work together.
That’s when we start exploring new tools.
Consider new tools
If after exploring the integrations available with the tools currently being used in your ecosystem, it may be time to consider replacing tools with limited integration abilities with more robust options that offer more flexibility.
For example, our client in the example above was using Weebly Forms to capture data through a few of their ecosystem’s doors. These forms offer very little in terms of their ability to automatically push form submission data to other systems, such as email marketing tools or donor databases.
We made the decision to move the client to WordPress and to use a new form tool called “Gravity Forms” that offers the ability to very simply integrate with dozens of other tools.
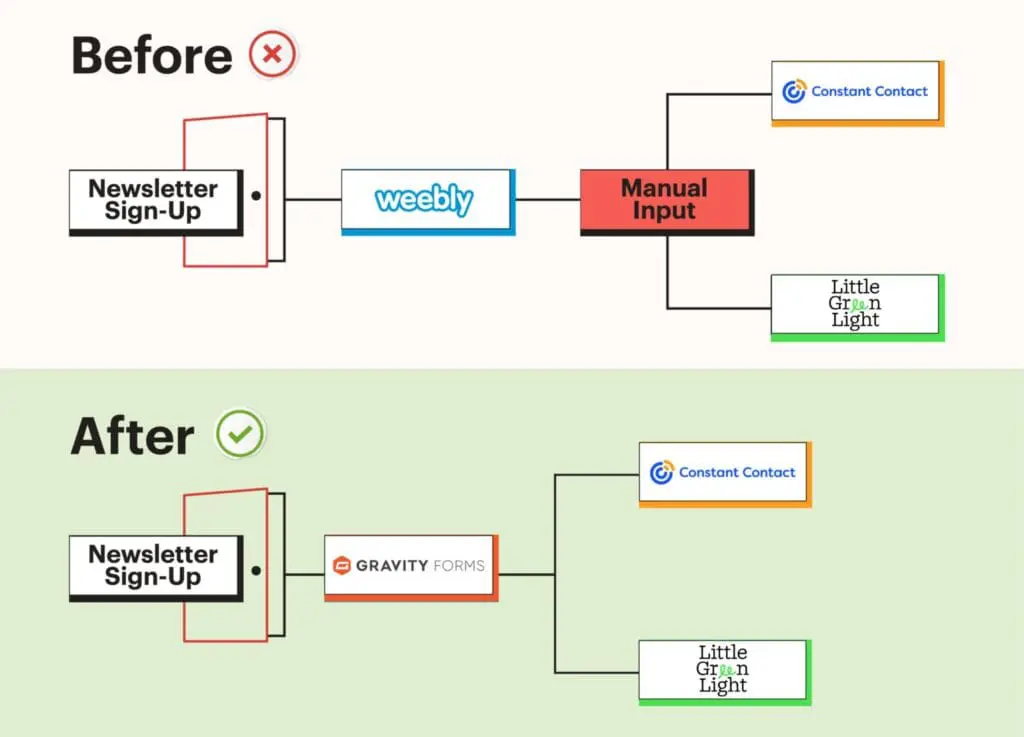
In the case of their newsletter sign-up, we were able to easily configure integrations for both their Constant Contact and Little Green Light accounts so that email address information was automatically sent to those tools.
We were able to remove one of the scary red boxes.
Similarly, we were also able to automate the transfer of data for the Volunteer Application.
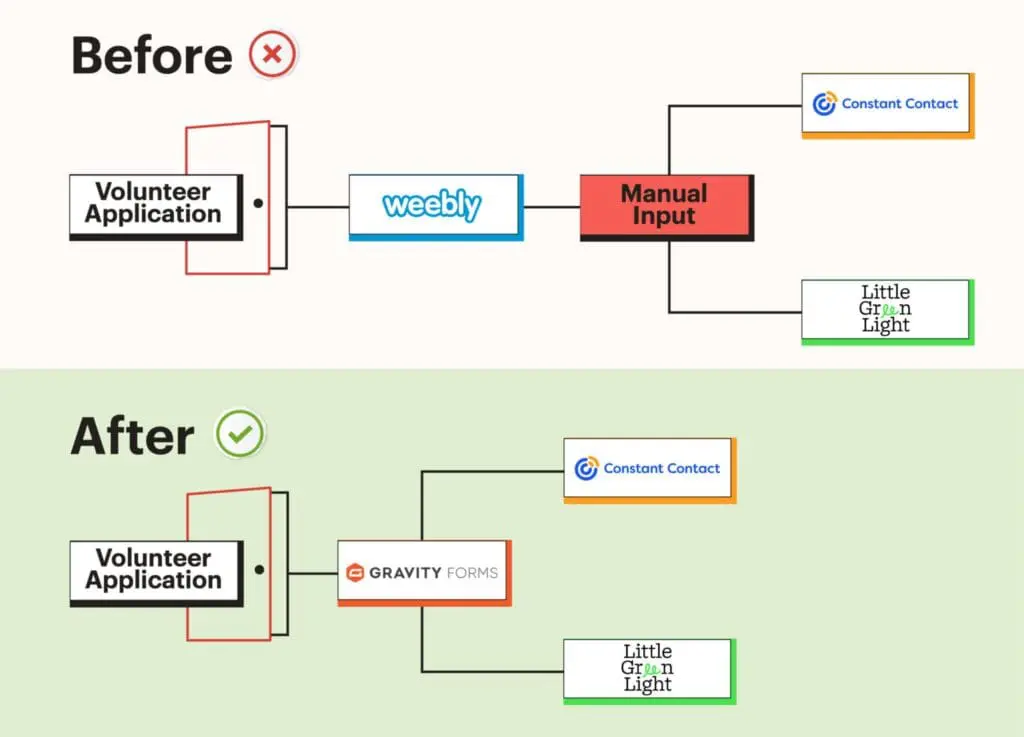
It’s incredible how replacing just one tool in an ecosystem you can already start to create major efficiencies and automations.
But what if you really don’t want to explore new tools. Maybe you’re happy with your existing tool or you just started using it and don’t have the appetite to replace.
That’s when the 3rd option comes in.
Bridge your tools with Zapier
Zapier is a tool that makes it easy to create custom automation for 1000s of different tools. It doesn’t require any programming knowledge, just a bit of time and desire to experiment.
They also have many template automation for some of the most frequently used tool combos.
For example, let’s say you want to automatically update donor data in Little Green Light when someone gives through your online giving tool, Fundraise Up.
While neither of these tools natively integrates, Zapier has pre-set automations that simply require a few clicks to configure.

In the case of our recent client example, we wanted to automatically send donor data from Givebutter to a few of the other tools in the client’s ecosystem.
Unfortunately, Givebutter didn’t support native integrations for these tools, but Zapier did!
Here’s how a typical Zapier integration might fit into your ecosystem:
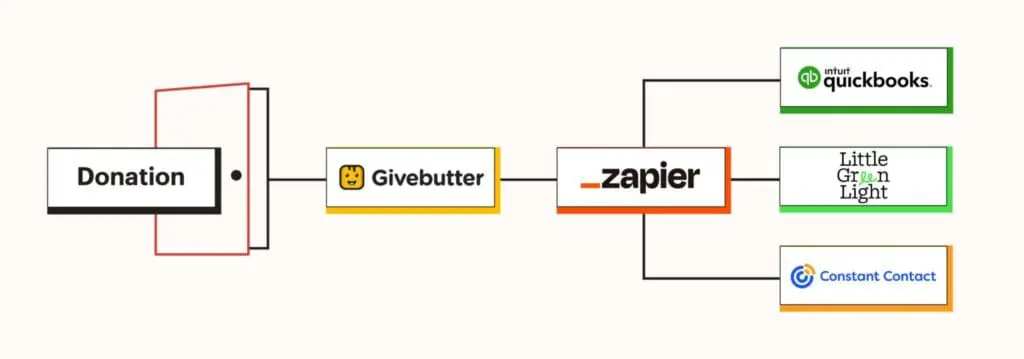
In this case, a donation is made through Givebutter and then Zapier automatically sends this data to Quickbooks, Constant Contact, and Little Green Light.
Talk with an expert
While we’ve tried our best to outline a DIY approach to streamlining your nonprofit’s tech ecosystem, it can still be very time-consuming and challenging to do this well.
An expert in this area will have experience working with many, if not all, of the tools in your current ecosystem and will quickly be able to tell you whether you need to find new tools that work better together, you can better use your existing tools, or if the simplest solution would be using a tool like Zapier as a bridge.